Research and Impact
Through the programs we create, encourage, and support, the Momentum Center can make a positive difference for many of our citizens, some of whom are among our most vulnerable.
We’re in the middle of a mental health crisis.
1 in 4 people in the US experience a mental illness during their lifetime.
In Ottawa County, 29% of youth report depression.
In a classroom of thirty students in Ottawa County, five of those students have seriously considered suicide and two have made an attempt.
Treatment helps. But mental health stigma is a large barrier.
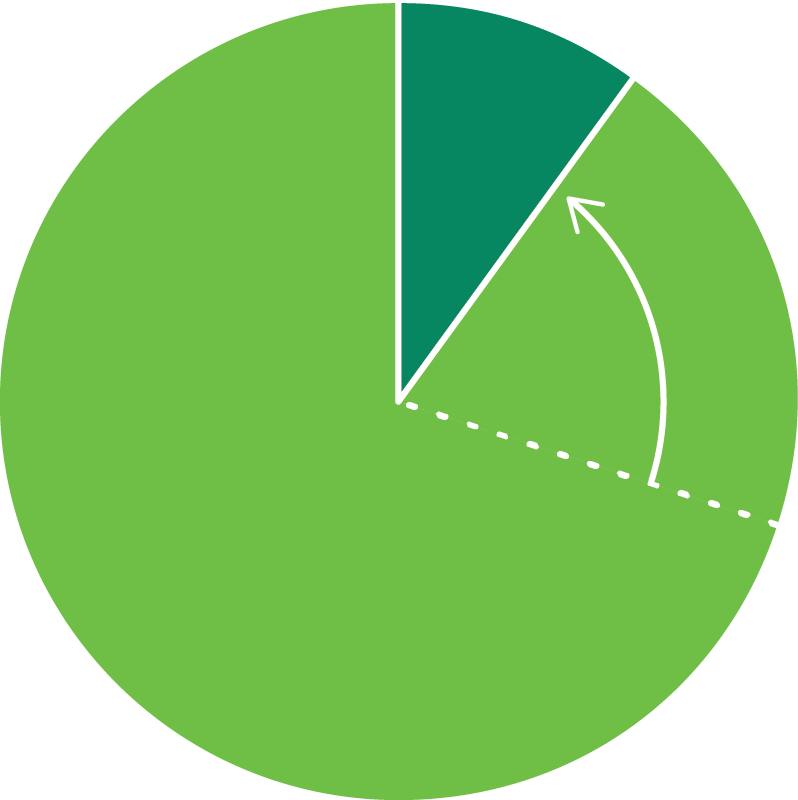
70-90%
Get better with mental health treatment
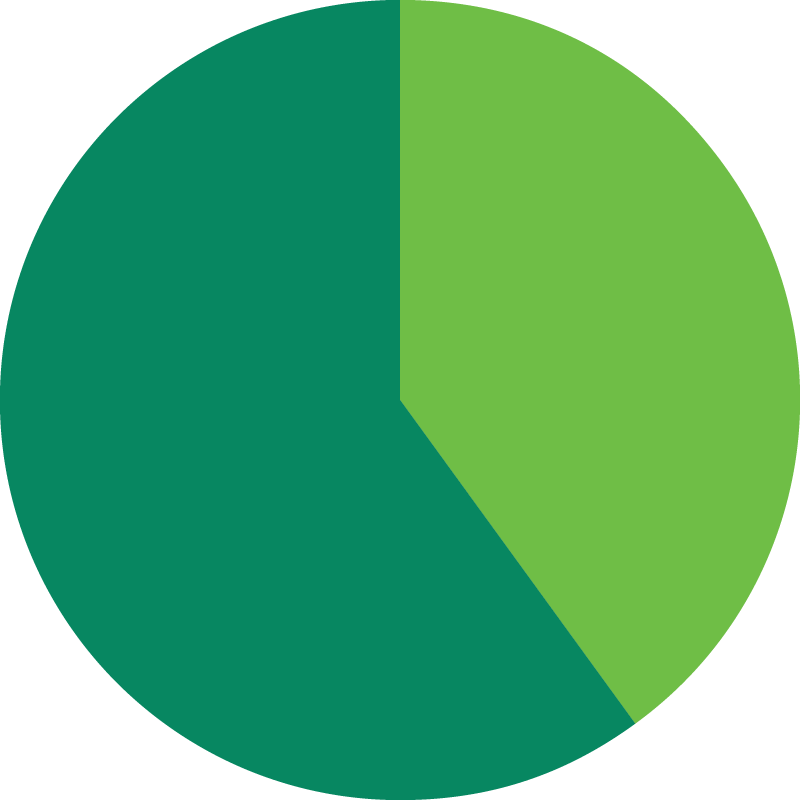
60%
But, 60% never seek treatment at all. The biggest barrier to seeking help is stigma.
58%
In fact, 58% say stigma is a harder challenge than the mental illness itself.
That’s where the Momentum Center came in.
We started by having community conversations in order to normalize the conversation. We began holding Inspire! events that focus on issues germane to marginalized populations. Over and over again, the theme of Mental Illness was raised. That led to hosting Town Hall Meetings that are sponsored by the City of Grand Haven, Ottawa County, Grand Haven Area Public Schools and North Ottawa Community Healthcare. Those conversations include panelist presentations and then move into community conversation. Those conversations and the direct feedback from the grassroots community led to the formation of the Mental Illness Task Force and the initial concept of the Momentum Center for Social Engagement.
The Momentum Center for Social Engagement is an innovative approach to serving individuals with mental illness, addictions, and other disabilities while also serving the entire community. It costs $1 per year to join the Momentum Center. By offering social and recreational activities, events, and outings, the Momentum Center allows often disenfranchised individuals to build healthy relationships, engage in positive activities, and move out of isolation and into productive interactions in their community. Within the Momentum Center is also the Momentum Center Café, which is a good place for social integration where stereotypes are dismantled and stigma is eliminated. The café is run by members of the Momentum Center. The Momentum Center also operates Just Goods Gifts. Just Goods is open to the public. Finally, Just Goods is an L3C that provides an external funding stream with all profits benefitting the Momentum Center.
The needs in our community only continue to grow. In Ottawa County:
1 in 5 adults are disabled
17% of adults report depression and 15% report an anxiety disorder
15% of youth have thought about committing suicide in the last year
Opiate related deaths have increased by 85%
Mental Health continues as a CRITICAL issue and is not improving. Top Four Concerns:
Stigma with mental illness
Lack of programs/services
Lack of funding for services
Lack of psychiatrists/therapy
Access to Care is a case of those who have and those who have not. Under-served adults had trouble meeting health care needs in the past two years, and skipped or stretched their medication to save on costs.
Normalizing the conversation, giving purpose, saving lives
Figure 1. Members reporting moderate to severe depression* at Intake had significantly reduced depression after 1 year.
Figure 2. Members reporting moderate to severe anxiety** at Intake had significantly reduced anxiety after 6 months.
Figure 3. Members reporting moderate to severe loneliness*** at intake had significantly reduced loneliness after 1 year.
Figure 4. Members reporting social connectedness at intake had significantly increased connections after 1 year.
Figure 5. Members reporting feelings of stigma at intake had reduced feelings after 1 year and beyond.
*Depression measured by PHQ-9 (High Scores = More symptoms of depression)
**Anxiety measured by GAD-2 (High Scores = More symptoms of anxiety)
***Loneliness measured by 3-Item Loneliness Scale (Hughes et al., 2004; High Scores = experiencing more loneliness)


